In the midst of its battle to contain the Gulf oil spill, BP in June released the 59th edition of its Statistical Review of World Energy, an always useful compendium of global energy data.
The full report, as well as other resources, is available here: BP Statistical Review of World Energy 2010. Below, TheGreenSupplyChain.com summarizes report highlights.
As with nearly everything else in 2009, the energy story was largely dominated by the global recession, which led world energy consumption (across all sources) to decline for the first time since the last severe recession in 1982, falling 1.1%.
Consumption of oil, natural gas and nuclear power declined, while coal consumption was essentially flat; only hydroelectric output and other renewable forms of energy increased in 2009 (however, still representing just a small part of the total).
Overall, however, “This data suggests global CO2 emissions from energy use fell for the first time since 1998,” the report notes.
Oil Trends
Oil prices decline year over year, for the first time since the recession of 2001, but took a sharp jump towards the latter part of 2009, as OPEC output cuts were even larger than the overall fall in global demand. The average price of oil was $61.67 in 2009, which was a decline of 37% versus 2008, the sharpest annual drop since 1986. However, prices began 2009 at below $40 per barrel, after the dramatic drop following the start of the financial crisis in September of 2008, and later reached a high of about $79 per barrel in November before fading a bit in the last month of the year.
Global oil consumption declined by 1.2 million barrels per day, or 1.7%, again making it the largest such decline since 1982.
Oil demand in developed countries fell by 4.8%, interestingly making 2009 the fourth straight year of decline in those developed markets. Demand in developing countries continued to rise, increasing by 2.1% in 2009, but this was the weakest year over year rise in developing countries since 2001.
Those trends mean developing countries in aggregate, at about 860,000 barrels per day, continue to move closer to the 1.2 million barrels per day consumed in developed markets.
However, global oil production fell in 2009 even more sharply than demand, falling by 2 million barrels per day, or 2.6%. Production fell even more in OPEC countries, where oil output fell by a sharp 7.3%.
Surprisingly, production actually rose outside of OPEC, led by the US, where oil output increased by 460,000 barrels per day, or 7%, the largest percentage gain by the US in the 59 years of the BP statistical review. That in turn led the US to account for 84% of the decline in global oil imports, as domestic production in the US reduced the need for foreign oil.
Even in the recession, global oil refining capacity grew by 2.2%. 80% of that growth, in turn, came from Asia, especially new refining capacity added in India and China.
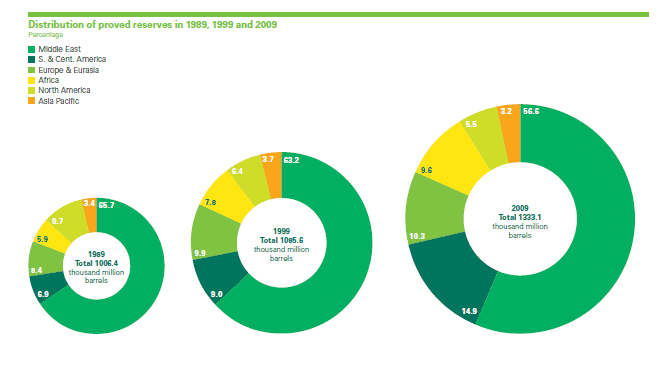
In terms of reserves, proven reserves of traditional oil (i.e., excluding shale oil) were essentially flat at the end of 2009 versus 2008, at about 1.33 billion barrels.
However, perhaps somewhat surprising to some given concern about Peak Oil, proven oil reserves have actually risen sharply since 1999, as shown in the graphic below, though reserve growth has slowed sharply in the past few years.

Source: BP Statistical Review of World Energy 2010
Other Energy Sources
Natural gas production fell sharply in 2009, dropping 2.1% for its largest annual decline on record. That was primarily due to the dramatic drop in most developed economies in terms of factory production, where natural gas is a key energy source. Prices dropped sharply in turn.
Global coal consumption was flat, but that masked some extremes, with coal consumption dropping sharply in developed economies and but growing rapidly in China, which accounted for an amazing 95% of the 7.4% growth in coal usage in developing markets.
All told, that led to coal accounting for 29.4% of total global energy consumption in 2009, its highest share since 1970, despite concerns about its higher level of greenhouse gas emissions per unit of energy.
Global nuclear output dropped by 1.3%, a third consecutive global decline. Asia-Pacific growth, led by a recovery of Japanese output from earlier earthquake-related outages, did not offset declines elsewhere, but these drops again were likely the result of decreased manufacturing activity and resulting electricity consumption.
Hydroelectric generation grew by a below-average 1.5%, which was nonetheless sufficient to make hydro the world’s fastest-growing major fuel in 2009.
Any reaction the BP energy statistical review? Let us know your thoughts at the Feedback button below.

TheGreenSupplyChain.com is now Twittering! Follow us at www.twitter.com/greenscm
|