Every June, TheGreenSupplyChain.com looks forward to the annual BP Statistical Review of World Energy, now in 2013 in its 62nd year. It is the most comprehensive source of global energy information available in the market.
The headline news was that in general, the growth of energy consumption was down globally, resulting from a combination of continued tepid global economic growth and a focus on reducing energy consumption in countries across the world.
World primary energy consumption grew by 1.8% in 2012, well below the 10-year average of 2.6%. Consumption in OECD countries (developed economies) fell by 1.2%, led by a decline of 2.8% in the US (the world’s largest decline in volume). That is the fourth time in the last five years that energy consumption in 34 OECD countries declined. The only year-over-year increase in that period was in 2010, coming off of the depressed economic year of 2009.
Non-OECD consumption grew by 4.2%, also below the 10-year average of 5.3%. But in volume terms, 90% of that consumption growth came from China and India alone.
Coal Continues to Gain Market Share
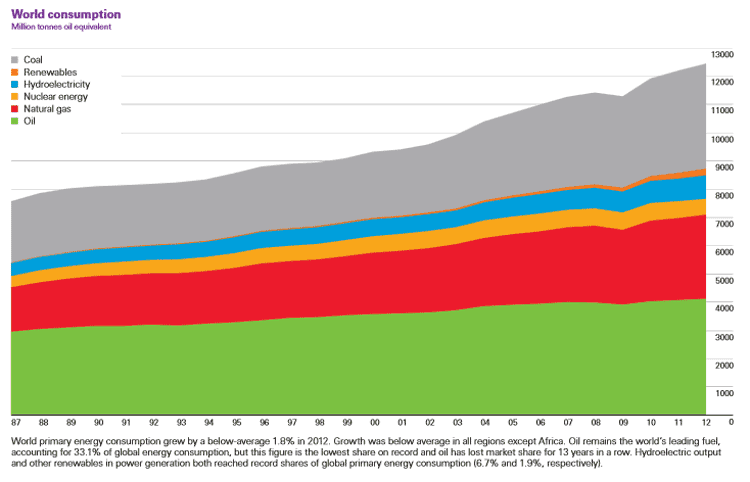
As the chart below shows, oil remains the top energy source in terms of consumption, providing 33.1% of global energy production - though as can be seen, its share has really flatlined in recent years. That percentage has declined for 13 consecutive years, and 2012 marked oil's lowest share of energy production since BP began tracking this statistic in 1965. (To be clear, the chart shows consumption of energy by source, not market share, meaning that oil's share can be shrinking against others even if its absolute totals are rising slightly).
Conversely, despite the environmental concerns, coal's share of consumption has continued to grow, reaching about 30% of the total, nipping at oil's heals, up from 29.6% in 2011. Most of that growth came from China, but interestingly, while coal consumption dropped sharply in the US in 2012, it rose in Europe for the third straight year, as natural gas prices rose sharply there.
Global Energy Consumption by Energy Source 2012

Source: BP Statistical Review of World Energy 2013
The contrast between the US and China and to an extent Europe with regards to coal is really quite stark. While there is sharp growth in China and modest growth in Europe in terms of the use of coal, in the US rail carriers reported declines in coal shipments in the mid-teen percentages quarter after quarter in 2012, a result of both low natural gas prices and efforts by the US EPA to move utilities away from use of coal.
Global oil consumption grew by 890,000 barrels per day (b/d), or 0.9%, below the historical average. Oil had the weakest global growth rate among fossil fuels for the third consecutive year. OECD consumption declined by 1.3% (530,000 b/d), the sixth decrease in the past seven years; the OECD now accounts for just 50.2% of global consumption, the smallest share on record.
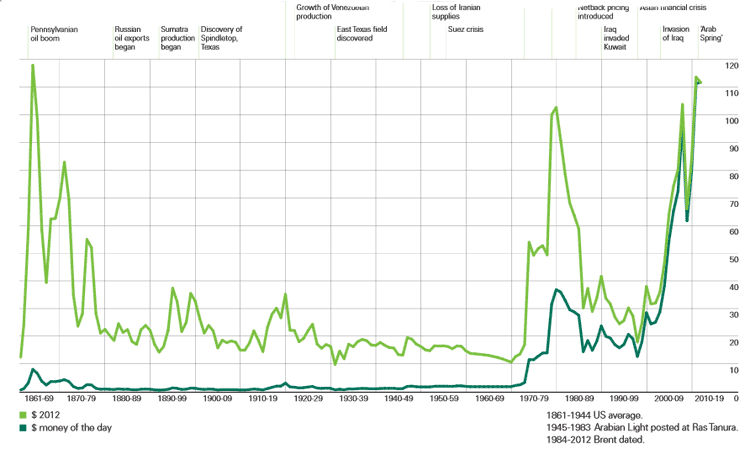
Oil prices were basically flat last year, with prices for Brent crude averaging $111.67 per barrel in 2012, an increase of just 40 cents per barrel. Currently, the price for Brent is about $106 per barrel.
Natural gas consumption grew just 2.2% in 2012, but was about double that in the US, where it rose 4.1%, while US natural gas production rose 4.7%.
China's share of coal energy consumption rose to an amazing 50.2% of the global total, with growth of 6.1%. By contrast, coal consumption in the US fell by almost 12%.
Global nuclear output fell by 6.9%, the largest decline on record for a second consecutive year. Nearly all of that, however, came from Japan, where output fell by 89%, accounting for 82% of the global decline following Japan’s nuclear power issues after the earthquake and tsunami in 2011.
Renewable sources are growing rapidly, but were just 1.9% of total consumption last year. Still, that is up quite a bit in percentage terms from its 1.6% share in 2011. Wind energy (+18.1%), accounted for more than half of renewable power generation growth, with China (+34.6%) perhaps surprisingly accounting for the largest increment in wind generation. Solar power generation grew even more rapidly (+58%), but from a smaller base.
We also like to show each year the chart of oil prices over time, which of course directly impacts the price of transportation fuels, as shown in the graphic below.
Brent Crude Oil Prices Over Time

Source: BP Statistical Review of World Energy 2013
Other than a brief period at the very start of the oil era, prices today in current dollars have never been higher (as shown in the light green line)., with annual averages in the past couple of years even higher than 2008, when crude reached record levels that summer but plummeted by year's end
It is also astounding to see as always that as recently as the late 1990s, oil prices were just $15 or so per barrel.
The full BP report is available here: BP Statistical Review of World Energy 2013
Any reaction to the data from the 2013 BP report? Let us know your thoughts at the Feedback button below.

|
|