As usual in June, BP last week released its annual Statistical Review of World for Energy 2016.The review is a sort of almanac of all matter of energy related data, now in its 65th year, and as always it is quite an interesting read.
The headline news is that global primary energy consumption increased by just 1.0% in 2015, similar to the below-average growth recorded in 2014 (+1.1%) and well below the 10-year average of 1.9%. Other than the recession of 2009, this represented the lowest global growth since 1998.
By contrast, world GDP grew at about 3.1% in 2015, according to the International Monetary Fund’s estimate, so energy consumption grew only about one-third the pace of economic growth.
Consumption growth was below the 10-year average for all regions except Europe and Eurasia. Amazingly, emerging economies accounted for 97% of the increase in global energy consumption.
Overall, OECD countries saw a small increase in consumption, with growth in Europe offsetting declines in the US and Japan. Chinese consumption slowed further, but still recorded the world’s largest increment in primary energy consumption for the fifteenth consecutive year.
Emerging economies now account for 58.1% of global energy consumption. However, growth in these countries of 1.6% was well below its 10-year average of 3.8%. This is likely a combination of lukewarm growth in many merging countries such as China combined with greater energy efficiencies.
Chinese consumption growth slowed to just 1.5%, while India (5.2%) recorded another robust increase.
By fuel, only oil and nuclear power grew at above-average rates, with oil gaining global market share for the first time since 1999. Renewables in power generation continued to grow robustly, to nearly 3% of global primary energy consumption, while coal consumption recorded the largest percentage decline on record.
Crude oil prices recorded the largest decline on record in dollar terms, and the largest percentage decline since 1986. The annual average price for Brent, the international crude oil benchmark, declined by 47%, reflecting a growing imbalance between global production and consumption.
Natural gas prices fell in all regions, with the largest percentage declines in North America; the US benchmark Henry Hub fell to its lowest level since 1999. Coal prices around the world fell for the fourth consecutive year.
Oil remained the world’s leading fuel, accounting for 32.9% of global energy consumption. Its share of consumption also rose slightly in 2015, no doubt due to plummeting prices, after 15 straight years of declines.
The US saw its oil production increase by about 1 million barrels per day, the world’s largest annual growth increment, and the US remained the world’s largest oil producer. That increase in production was more than half of the total global increase in oil output of 1.9 million barrels per day.
World natural gas consumption grew by 1.7% in 2015, a significant increase from the very weak growth (0.6%) seen in 2014 but still below the 10-year average of 2.3%
Global coal consumption fell by 1.8% in 2015, well below the 10-year average annual growth of 2.1%. All of the net decline was accounted for by the US (-12.7%) and China (-1.5%), partially offset by modest increases in India (4.8%) and Indonesia (15%).
Renewable energy sources in power generation continued to increase in 2015, reaching 2.8% of global energy consumption, up from 0.8% a decade ago. Renewables accounted for 6.7% of global power generation, as China (20.9%) and Germany (23.5%) recorded the largest increments in use of renewables.
Globally, wind energy (17.4%) remains the largest source of renewable electricity (52.2% of renewable generation), with Germany (53.4%) recording the largest growth increment. Solar power generation grew by 32.6%, with China (69.7%), the US (41.8%) and Japan (58.6%) accounting for the largest increases.
China overtook Germany and the US to become the world’s top generator of solar energy.
However, global biofuels production grew by just 0.9%, well below the 10-year average of 14.3%.
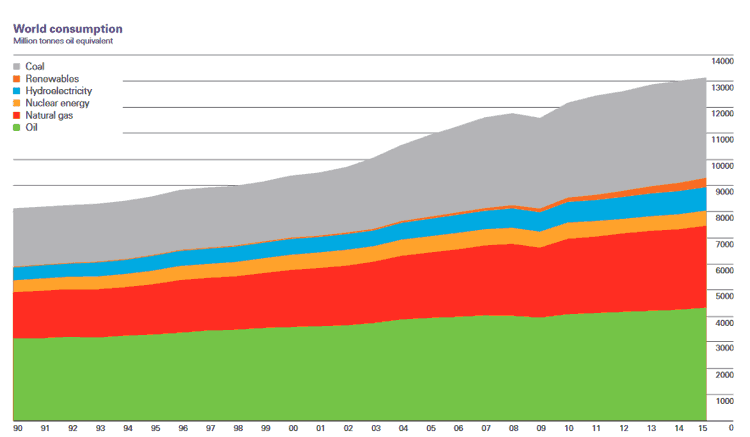
A chart showing global energy consumption by fuel source over time is shown below:

Source: BP
With the slowdown in overall energy consumption, BP estimates that CO2 emissions from energy consumption increased by only 0.1% in 2015. Other than the recession of 2009, this represented the lowest growth rate since 1992. This encouraging outcome was driven by a combination of slightly slower energy consumption growth and a shift in the global fuel mix (with lower global coal consumption partly offset by growth in natural gas and non-fossil fuels).
There's a lot more, and we encourage you to take a look at the report, which is available here: BP Statistical Review of World Energy 2016.
Good job by the experts at BP again this year
Any reaction to this year's BP report? Let us know your thoughts at the Feedback button below.

|