One of our favorite reports each year is the BP Statistical Review of World Energy, and as usual the 2014 report has been released in June, once again presenting simply an incredible amount of information relative to energy matters across the globe.
Amazingly, this is the 63rd edition of the study, which reports on 2013 energy data.
We summarized some of the highlights of the report last week, including that total energy consumption worldwide was up 2.3% in 2013, up from 1.8% in 2012 but a bit below recent the 10-year average of 2.5%. (See BP Releases 2014 Version of Its Statistical Review of World Energy.)
This week, a summary of 2013 trends and developments by different sources of energy.
Oil
Dated Brent averaged $108.66 per barrel in 2013, a decline of $3.01 per barrel from the 2012 level. West Texas Intermediate (WTI) continued to trade at a large discount to Brent ($10.67 per barrel lower), driven by growing US production.
Global oil consumption grew by 1.4 million barrels per day (b/d), or 1.4% - this is just above the historical average. Countries outside the OECD now account for the majority (51%) of global oil consumption and they once again accounted
for all of the net growth in global consumption.
Developed country (OECD) consumption declined by 0.4%, the seventh decrease in the past eight years. The US (+400,000 b/d) recorded the largest increment to global oil consumption in 2013, outpacing Chinese growth (+390,000 b/d) for the first time since 1999.
US oil production (+1.1 million b/d) recorded the largest growth in the world and the
largest annual increment in the country's history for a second consecutive year. The US accounted for nearly all (96%) of the non-OPEC output
increase of 1.2 million b/d.
All that said, oil's 32.9% share of global energy consumption was the lowest since BP
began tracking the measure in 1965, and meant oil lost market share for
the fourteenth consecutive year.
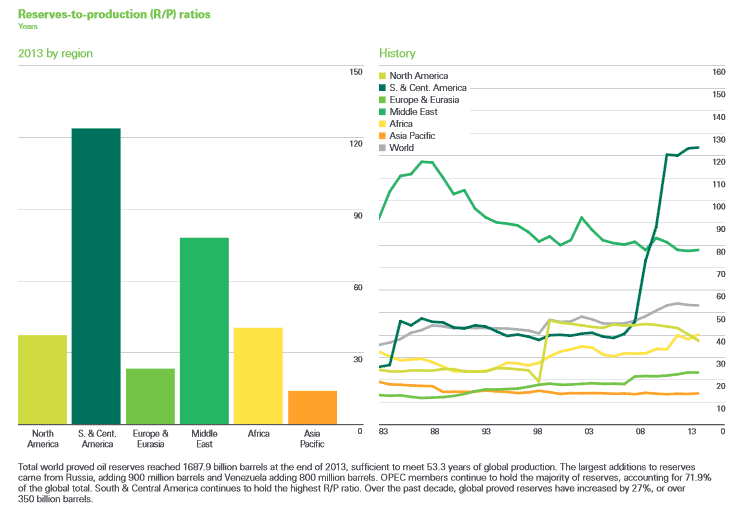
We also like this chart shown each year in the report, illustrating global oil production versus claimed oil reserves.

Source: BP Statistical Review of World Energy
Noteworthy, as can seen, is that the reserves to production ratio is continuing to fall in the Middle East, while the growth in reserves comes largely from Venezuela and Russia, whose numbers some question.
That said, total world proved oil reserves reached 1687.9 billion barrels at the end of 2013, sufficient to meet 53.3 years of global production. The largest additions to reserves came from Russia, adding 900 million barrels and Venezuela adding 800 million barrels. OPEC members continue to hold the majority of reserves, accounting for 71.9% of the global total. South and Central America (largely Venezuela) continues to hold the highest R/P ratio.
Over the past decade, global proved reserves have increased by 27%, or over 350 billion barrels, perhaps conflicting with "Peak Oil" theory.
Natural Gas
Perhaps surprisingly, world natural gas consumption grew by 1.4%, below the historical average of 2.6%. Consumption growth was above average in the OECD countries (+1.8%) and below average outside the OECD (+1.1%).
In fact, growth was below average in every region except North America. China (+10.8%)
and the US (+2.4%) recorded the largest growth increments in the world, together accounting for 81% of global growth, as China's economy continued to grow rapidly, and the US is enjoying a natural gas boom from fracking.
Globally, natural gas accounted for 23.7% of primary energy consumption.
Coal
Despite concerns over CO2 emissions, coal consumption grew by 3% in 2013, well below the 10-year average of 3.9% but still placing it as the fastest-growing fossil fuel. Coal's share of global primary energy consumption reached 30.1%, the highest since 1970.
China recorded the weakest absolute growth since 2008 but the country still accounted for 67% of
global growth. India experienced its second largest volumetric increase on record and accounted for 21% of global growth. OECD consumption increased by 1.4%, with increases in the US and Japan offsetting declines in the EU.
Nuclear
Global nuclear output grew by 0.9%, the first
increase since 2010. Increases in the US, China
and Canada were partly offset by declines in
South Korea, Ukraine, Spain and Russia.
Japanese output fell by 18.6% and has fallen by 95% since 2010. Nuclear output accounted for 4.4% of global energy consumption, the smallest share since 1984
Renewables
Renewable energy sources - in power generation
as well as transport - continued to increase in
2013, reaching a record 2.7% of global energy
consumption, up from 0.8% a decade ago.
Renewable energy used in power generation
grew by 16.3% and accounted for a record 5.3%
of global power generation.
China recorded the
largest incremental growth in renewables,
followed by the US, while growth in Europe's
leading players - Germany, Spain and Italy - was
below average.
Globally, wind energy (+20.7%)
once again accounted for more than half of
renewable power generation growth and solar
power generation grew even more rapidly
(+33%), but from a smaller base.
Global biofuels
production grew by a below-average 6.1%
(80,000 b/d), driven by increases in the two
largest producers: Brazil (+16.8%) and the
US (+4.6%).
The full report can be found here: BP Statistical Review of World Energy 2014
Any reaction to this BP data? Let us know your thoughts at the Feedback button below.

TheGreenSupplyChain.com is now Twittering! Follow us at www.twitter.com/greenscm
|